


Using the SANSA Earth Observation Catalogue
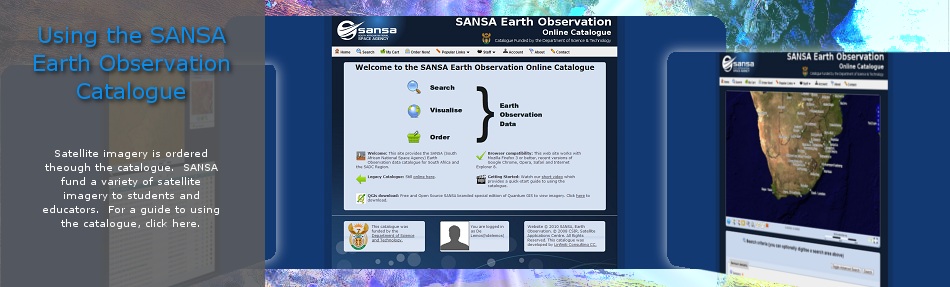
The SANSA Earth Observation catalogue contains a very large selection of satellite imagery dating back as early as 1972. Archived satellite images that are found here can be ordered via the catalogue. Tasking requests for imagery is done through SANSA Earth Observation customer services. SANSA Earth Observation (formerly known as CSIR-SAC-EO) has been acquiring satellite earth observation data since the early 1980's when reception of Landsat-2 MSS data commenced. Data on our archives is funded to students from South Africa. We also order high resolution satellite imagery for students at a discounted rate.
This guide will help you to better understand how to use the SANSA Earth Observation Catalogue.
A pdf version of this guide can be downloaded here.
To see the amount of imagery per sensor on the catalogue, click here.

A quick video tour of the catalogue.
Guide
Begin by navigating your internet browser to the SANSA Earth Observation Catalogue
If you have an account select login, otherwise register. Once you have confirmed registration, login.
Select search from the navigation bar. This will take you to the search criteria page. You will then see a map and the search criteria below.
The map lets you explore your areas of interest. It also allows you to digitise a polygon containing your area of interest. The results of your searches are displayed in the map window as yellow image footprints.

Map window tools

The map help icon displays a pop-up window when selected. It explains the map navigation and digitising tools as well as some useful keyboard shortcuts.

The zoom in and zoom out icons allow the user to zoom in and out of the map by clicking or drawing rectangles.

Use the pan icon on the map to enable map panning by clicking and dragging on the map.
! You can also pan the map by clicking and dragging with the mouse wheel

Use next view to quickly jump to the next map view. This works only with a previous view.

Previous view allows you to quickly jump to the previous map view.

Digitising/capturing a polygon over your area of interest in the map window is not necessary but recommended. To capture a polygon over your area of interest, use the capture polygon icon,
Left click to add points and double click to finish capturing the polygon.

The modify polygon icon is located to the right of the capture polygon icon. It is used to edit/modify the captured polygon. left click to move/add points, hover over and press delete to remove points.

The delete polygon icon deletes the captured polygon

Coordinates are displayed in the lower left of the map window. The coordinates continuously update as you move the cursor around the map view,

The scale bar is displayed on the lower center of the map window. Hover the cursor over the scale bar to display the scale text.

Use the restore and fullscreen icons to quickly resize the map window. The restore map to original size icon will restore the map window to its default size. The resize map to fullscreen icon will resize the map to fill the current browser window.

On the upper right corner of the map window you will see a layers tab. Clicking on it will allow you to change your base layer and overlays.

Once a polygon has been captured over your area of interest, you may then fill in the required search criteria in the fields below the map window. Note that it is not necessary to digitise a polygon over your area of interest although it is recommended. You can still search imagery by specifying only the required search criteria.
By default the catalogue is set to simple search criteria. The only fields required for a simple search are the sensor and date range. To toggle advanced search criteria click the toggle advanced search button.
Using simple search criteria
Select your sensor(s), hold in ctrl and click to select multiple sensors. In the date field specify your date ranges. Specify the start and end date and then click the add date range icon (the right pointing arrow icon) to add the date range to the list. Multiple date ranges can be added in this manner. To remove a date range, first select it in the date range list and then click the remove date range icon (the left pointing arrow icon).


Using advanced search criteria
The advanced search criteria are optional. Filling in these criteria can be used to further refine image searches. The advanced criteria are explained below.
Product type details
Search type allows you to select between different types of data. By default it is set to search optical products however, radar and other geospatial products can be selected. License type allows you to select between free, government, and commercially licensed products. Do not worry about this criterion, rather opt to keep it at it's default of neither.

Sensor details
The Mission option allows you to select from a list, the satellite mission. Once you've chosen the mission you can then specify the sensor type e.g. Mission = LS-5(Landsat 5), sensor type = TM-5 (Visual, NIR, SWIR and thermal). If the sensor has more than one acquisition mode you may select an option from the list.
List of available missions on the catalogue
ZASat-002 - SumbandilaSat
SAC-C - Scientific Application Satellite-C
LS-2 - Landsat 2
LS-3 - Landsat 3
LS-4 - Landsat 4
LS-5 - Landsat 5
LS-7 - Landsat 7
SPOT-1 - Systeme Pour l'Observation de la Terre 1
SPOT-2 - Systeme Pour l'Observation de la Terre 2
SPOT-3 - Systeme Pour l'Observation de la Terre 3
SPOT-4 - Systeme Pour l'Observation de la Terre 4
SPOT-5 - Systeme Pour l'Observation de la Terre 5
CBERS-2B - China, Brazil Earth Resources Satellite

Image details
'Use cloud cover' by default this is unchecked, check it if you want to limit searches to optical products with a certain cloud cover. Sensor inclination angle start and end, lets you specify the acquisition angles that the imagery were captured with. Spatial resolution allows you to select the mean spatial resolution class. The cloud mean lets you select the maximum cloud cover (range 0 -100) when searching for images. Note that not all sensors support cloud cover filtering. The band count allows you to specify the spectral resolution.

Row and Path
K orbit path, insert the orbit path as a list of comma seperated values or ranges (e.g. : "10, 20, 30" or "20-40"). J frame row, allows you to insert the frame row as a list of comma seperated values or ranges (e.g. : "10, 20, 30" or "20-40").

Geometry
Area of interest lets you specify bounding box coordinates seperated by a comma for upper left and lower right coordinates (e.g. 20, -32, 22, -34), or enter single coordinate which defines a circle center and radius in kilometers (e.g. 20, -32, 100). Alternatively, digitise a polygon for your area of interest on the map. The geometry file lets you upload a zipped shapefile or KML/KMZ file. The uploaded file must be less than 1 Mb. For best results the uploaded file should contain one polygon. if the uploaded shapefile or KML/KMZ contains multiple polygons, only the first polygon will be used. Complex polygons will increase the time it takes to search for products. To upload your zipped shapefile or KML/KMZ, select the 'choose file' button and then browse to where your zipped file is stored on your computer. Select it and then click ok.

The advanced search criteria are for individuals who have very specific search criteria and know exactly what they want. Every time an optional criterion is defined, it further filters the search results. Administer care when specifying optional criteria. If you are unsure it is a good idea then to start off with the simple search criteria.
Search Results
When you are satisfied with your search criteria and have at least filled in the minimum required criteria (sensor and date range), click the search button. This will bring you to the search summary page. The results of your search are listed as records in a list. The image foot prints of those records can be viewed in the map window. The search results metadata can be downloaded and viewed in a GIS. To go back to the search criteria and make modifications, click the modify this search button. When you click on an image foot print in the map window or list of records, you can view a preview of the image in the preview tab/box. You may also preview the image by selecting the image thumbnail in the list of records. A selected record is highlighted with a red border in the map window.


The preview tab/box.

Click this icon in the preview tab or records list to view the metadata of the product.

Click this icon in the preview tab or records list to add a product to your basket.

Click this icon in the preview tab or records list to see a larger preview image of the product.

This icon indicates that no preview image is available for the selected product.

This icon refers to the ammount of cloud cover present in the optical image product. UNK,means the cloud cover is unavailable for the optical image product. Always take care when previewing optical image products. Do not assume that a low cloud cover value or UNK means the image is clear of cloud cover. For best practice always preview the product before adding it to your basket.
Ordering
Products added to your basket can be viewed in the basket tab/box. Items in the basket can be removed by clicking the remove icon. When you are satisfied with the products in your basket, click order now. This will bring you to the create new order page. You will be required to specify the following:

Projection : Select from a list of options the preferred projection coordinate system that you would like the products in. Choose from geographic coordinate, UTM or Google Mercator.
Datum : Choose the datum you want your products in. Currently only WGS84 is offered.
Resampling method : Choose the resampling method you would like applied to your products. Nearest neighbour and cubic convolution are offered. It is best practice to select the cubic convolution resampling method for continuous data and nearest neighbour for discrete data. Cubic convolution is a good option for optical satellite imagery.
File format : Image products can be delivered in either GeoTiff, ERMapper compressed wavelet(ECW), or JPEG 2000 format. Both ECW and JPEG 2000 use compression to keep file size low at the expense of the products detail. If you would like to retain detail, select GeoTiff.
Area of interest : Enter bounding box coordinates separated by comma for Upper left and Lower right coordinates i.e. (20,-32,22,-34), or enter single coordinate which defines circle center and radius in kilometers (20,-32,100). Alternatively, digitise the clip area in the map.
Geometry file : If you would like the product(s) to be clipped and masked to a specific geographic region, you can digitise that region using the map above, or the geometry input field. Upload a zipped shapefile or KML/KMZ file of less than 1MB. If the shapefile contains more than one polygon, only the first will be used.
Notes : If you need specific processing steps taken on individual images, please use the notes to provide detailed instructions.
Delivery method : Specify from the options how you would like the products to be delivered to you.
Market sector : You must specify that you are either academic-staff research or academic-student. It is very important that you specify this. Certain data is free to the whole public and other data which usually carries a cost is funded provided you are a South African student.

Once you are satisfied with your order , click Submit Order.
If you are ordering SumbandilaSat, SAC-C or CBERS-2B data, you will be provided with a download link sent to your email address immediately. SumbandilaSat, SAC-C, and CBERS-2B data are free to the whole public. Currently no processing is offered for these products however, the public have unlimited access to these freely available datasets. If you are ordering commercial data such as SPOT-5 and Landsat, you will be contacted by customer services. Commercial data sets on our archive are funded to students provided they can provide us with proof of their research. Customer services usually request a letter from the student's supervisor or superior. The letter should state that the student is registered, provide a description of the research, and lastly list the required satellite image(s). The letter must be signed by the student's supervisor and should contain the universities contact details. In order to avoid scenarios where the student over orders imagery, SANSA provides students with a maximum of 10 satellite images per annum. The student should do their own searches on the catalogue unless they require imagery not provided on the catalogue. In such a case, the student must contact customer services. If the student requires more than the capped amount, their supervisor or superior will be required to justify as to why in writing on their letter. The signed letter must be sent back to customer services either by scanning the document and emailing it, or mailing it in the post. Customer services will provide the student with all the necessary information.
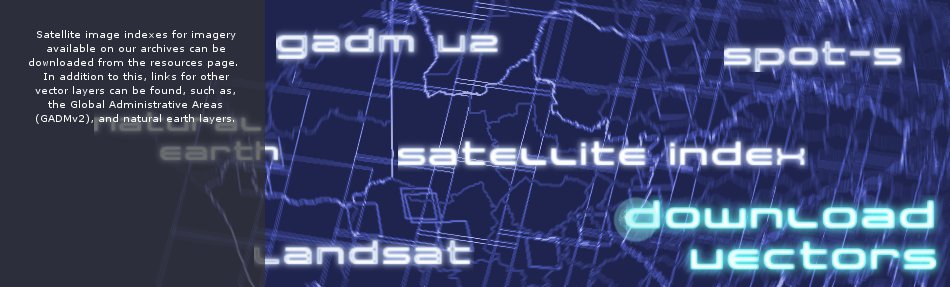
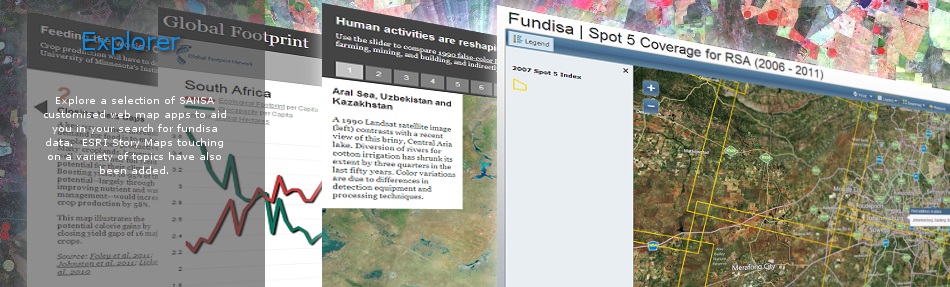
About Resources
On this page you will find a variety of links with descriptions to earth observation resources, ranging from user guides, commercial catalogues to free data sources, other portals and softwares. Should you know of any other interesting links, please send them to us and we will add them to the resources webpage.
Learning Material
Radar Imagery
Earth Observation Portals
Contact Information
About Us

Affiliates

Department ofSience & Technology

Astrium - SpotImage